Progress Tracking with Dashboards That Don't Lie
Most progress dashboards optimize for looking green. We optimize for surfacing slippage. Here's how to build dashboards in Tellzm that catch real problems early.
A dashboard that's always green is a dashboard nobody is reading.
There's a temptation, building a dashboard, to pick metrics that always look good. Resist it. The point of a dashboard is to make problems show up faster than they would in a meeting. If yours never has a red number, your team is either heroic or your numbers are wrong.
The three signals worth tracking
- Movement — count of tasks status-changed in the last 7 days. Stalled work is the loudest early signal.
- Cycle time — median days from 'in progress' to 'done'. If it's drifting up, something's wrong.
- Owner balance — work-in-progress per assignee. A single overloaded owner takes the whole quarter down.
Build the dashboard once, run it weekly
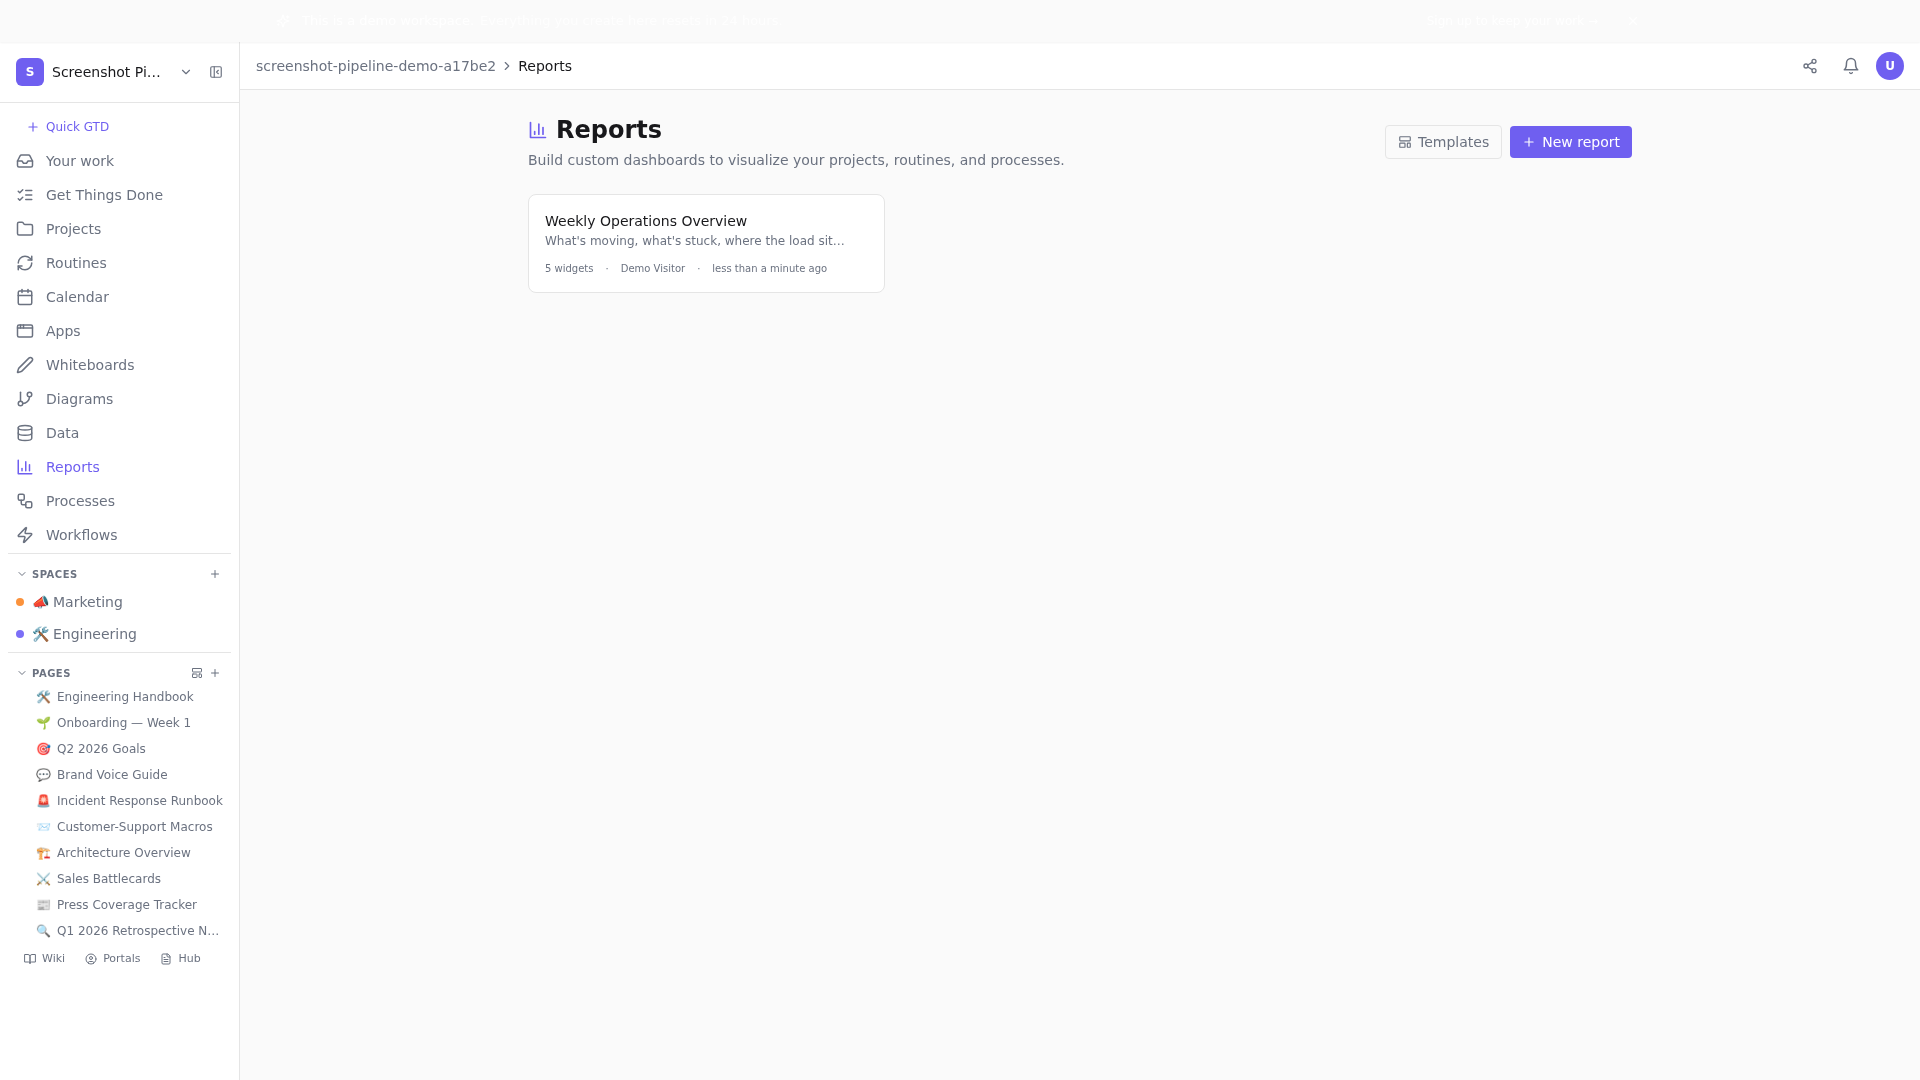
Tellzm's report builder lets you drag widgets onto a canvas. Build it once with five widgets — never seven, never four. Five fits in one screen, gets read in 90 seconds, and lives a year.
When to escalate
- Cycle time up 30% for two consecutive weeks → review the bottleneck before next sprint.
- A single owner with >12 in-progress tasks → 1:1 the same day.
- Zero movement on any milestone for 10 days → assume it's blocked.
Dashboards exist to start conversations. If yours doesn't start any, you have the wrong widgets.Open the demo dashboard and see a real five-widget report.
Related posts
The Complete Progress Tracking Manual
Stop optimizing dashboards for looking green. Start designing them to surface slippage early. A field manual on the metrics, dashboards, and weekly rituals that catch real problems before they become incidents.
Cycle Time: The Only Velocity Metric That Matters
Story points are gameable. Throughput depends on team size. Cycle time is honest. Here's how to track it in Tellzm and what to do when it drifts.
Leading Indicators Beat Lagging Ones — Every Time
Revenue is a lagging indicator. Churn is a lagging indicator. By the time they move, the cause was three months ago. Track leading ones instead.
The 45-Minute Weekly Business Review
Most WBRs run 90 minutes and accomplish 30 minutes of work. Here's how to cut the fat without cutting the rigor.